CASE STUDY
How Kalon helped Vizient
save 200+ hours per month
with a custom PL Hub dashboard
Strategy
UI/UX Design
Web Development
Accessibility Audit
CASE STUDY
Strategy
UI/UX Design
Web Development
Accessibility Audit


How we built a custom dashboard for Vizient to save their project leads hours every month.

Design
UX Research
Blazor Front-end Development
SQL Database
Automation
Web
Okta
Vizient’s project management team needed a smarter way to handle complex workloads, report health metrics, and monitor progress across multiple systems. Their project leads were spending hours each month juggling data between Kantata, Tableau, and manual spreadsheets just to create accurate reports.
To eliminate repetitive work and give teams real-time visibility into project health, Kalon built a unified Project Lead Hub — a custom web application that integrates data from Kantata and Tableau into a single, actionable dashboard. The result: faster reporting, fewer errors, and more confident decision-making.
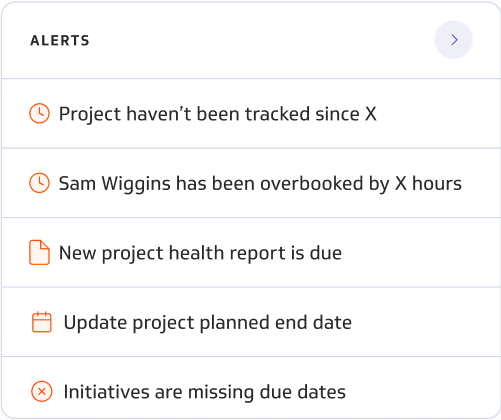
Project leads were switching between multiple tools — manually merging data to track progress and report results.
This manual process created several challenges:

Reporting consumed several hours each week.
Data mismatches caused uncertainty in project status.
Delayed insights slowed corrective actions.
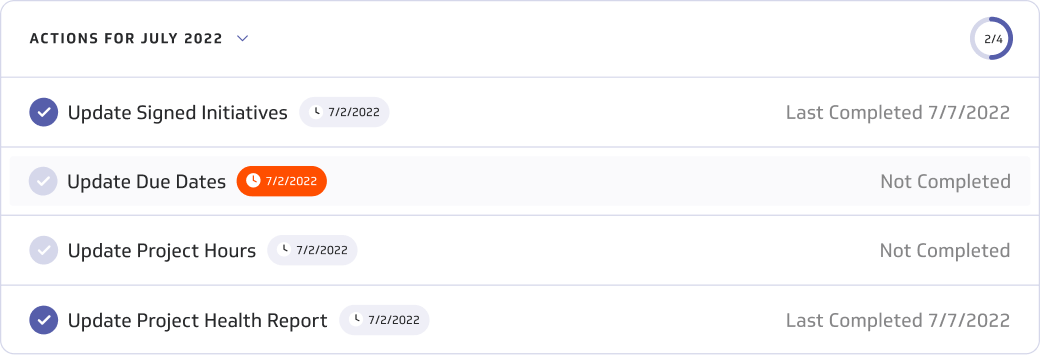
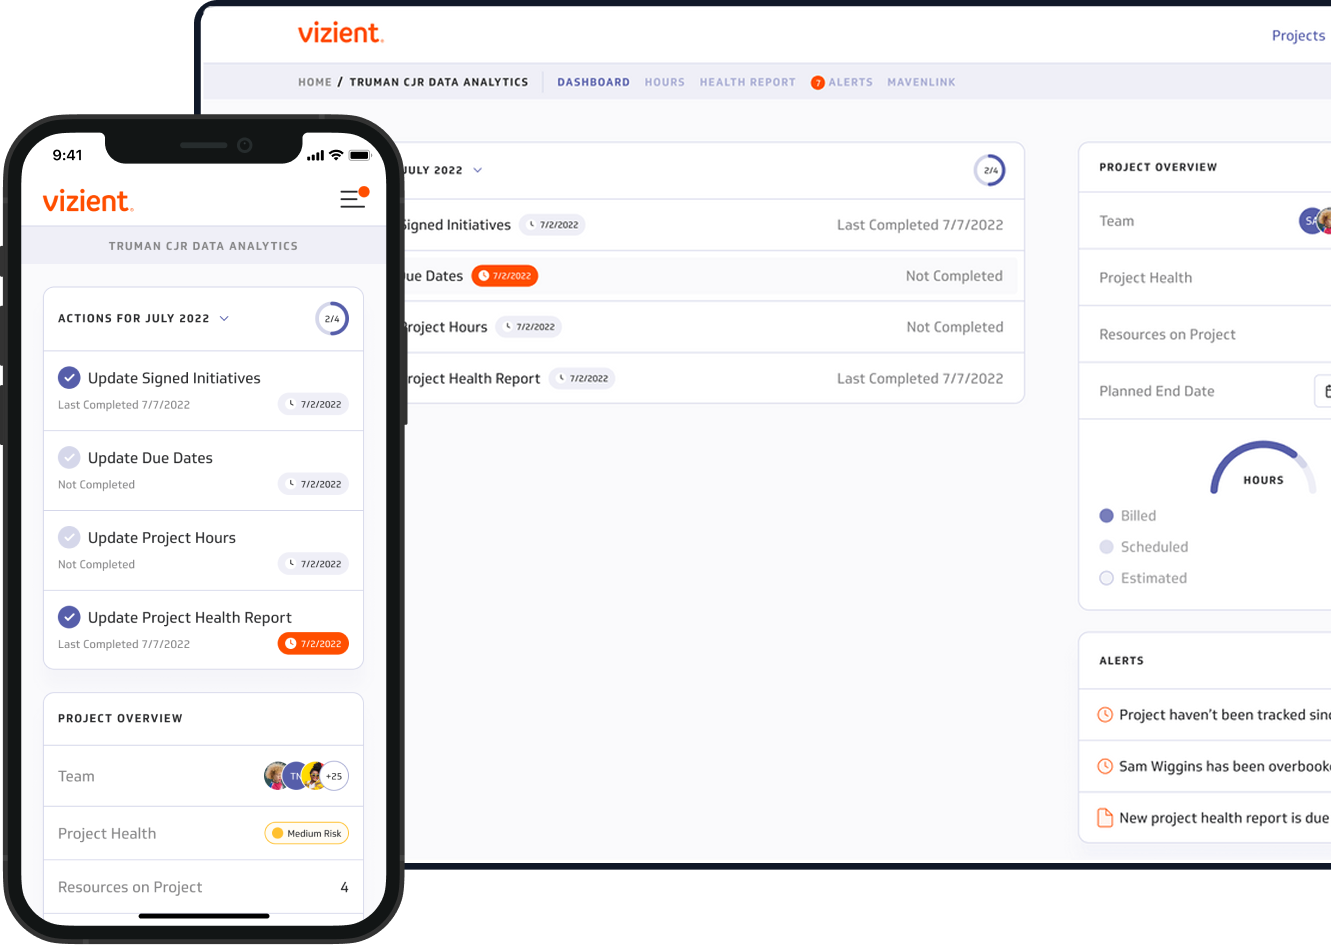
Kalon built a custom Project Lead Hub that unites Kantata data and Tableau analytics in one real-time dashboard. The Hub automates reporting, synchronizes data, and visualizes key metrics for faster decisions.
Key improvements include:
Automated data sync replaced manual exports.
Real-time insights for every project lead.
Monthly reports completed in minutes, not hours.
With every project Kalon takes on, we want to know what success looks like for our clients so that we can build a solution that has a positive impact on the business instead of simply building to a spec.
From the outset, we engaged closely with stakeholders to pinpoint the key wins and shaped the platform with a deliberate focus on achieving those specific objectives. This collaborative approach ensured that the resulting solution truly addressed Vizient's needs and contributed to their ongoing success.
can complete their daily tasks faster and with fewer steps.
are generated automatically with accurate data and clear project insights.
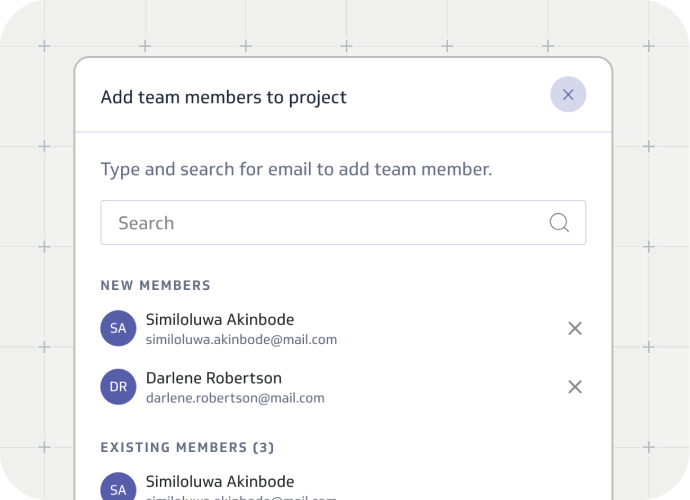
onboard faster thanks to guided workflows and smart prompts.
Crafting a design system that aligns with UI standards while staying true to the established brand involves thoughtful grid alignment, consistent typography, and a cohesive color palette. Each element is designed to capture the user's attention and reinforce the brand’s identity in a visually appealing way.
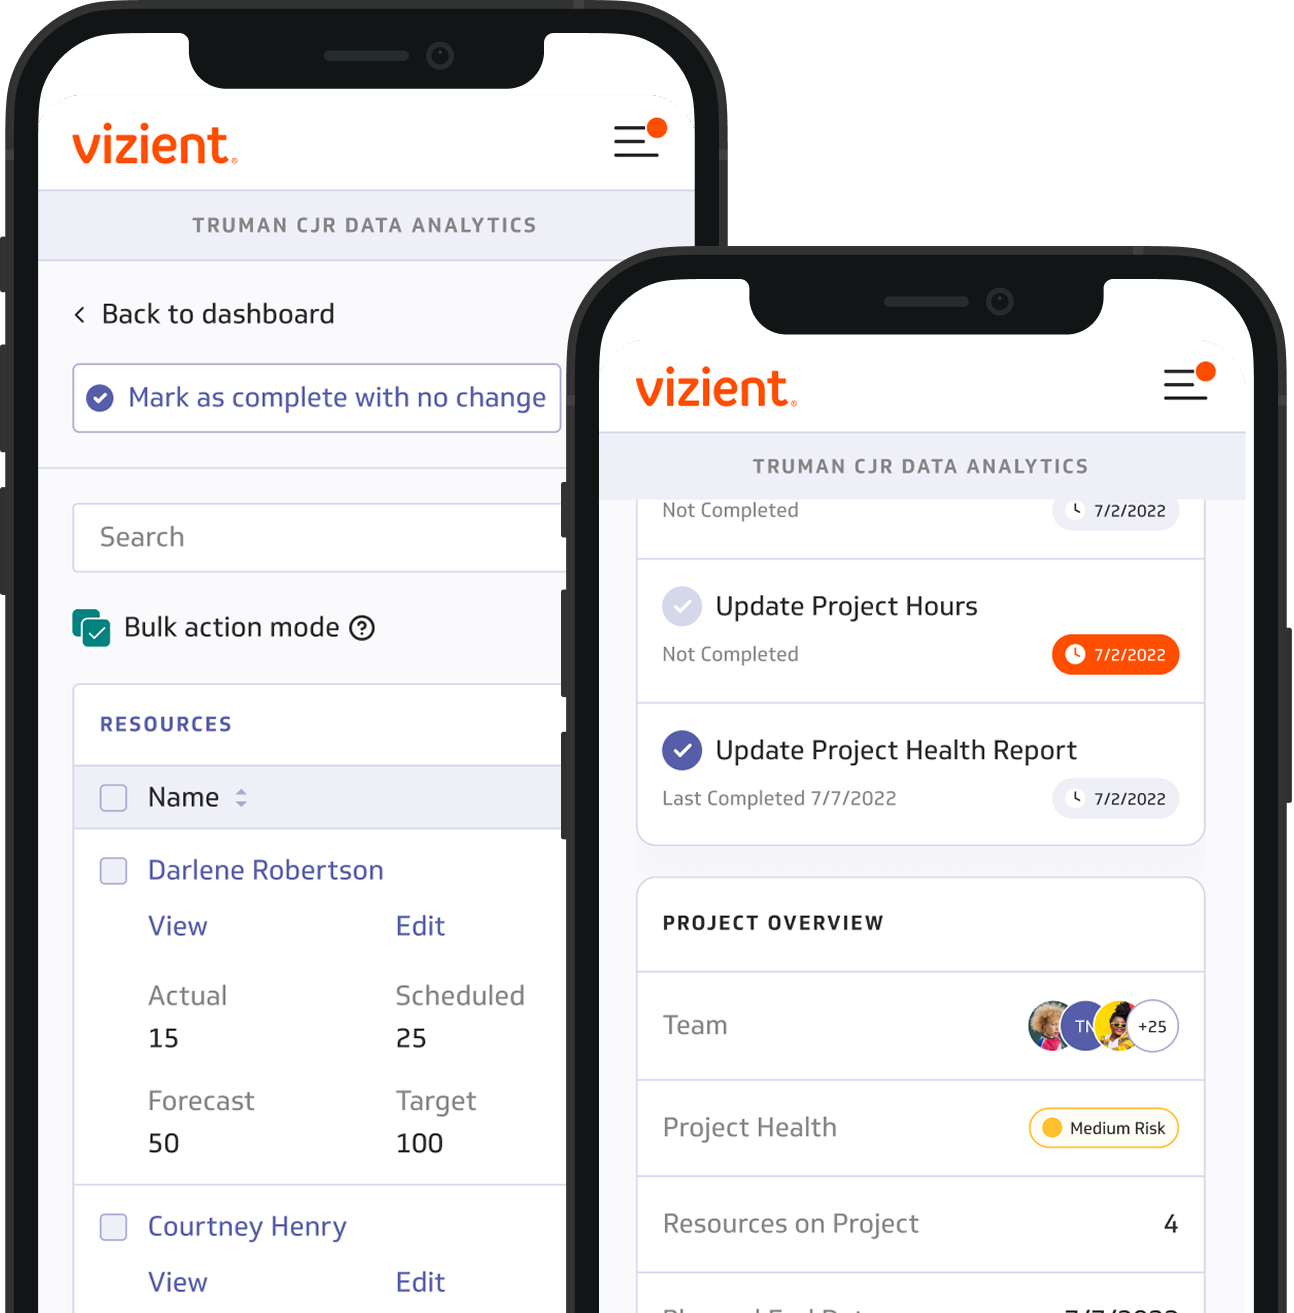
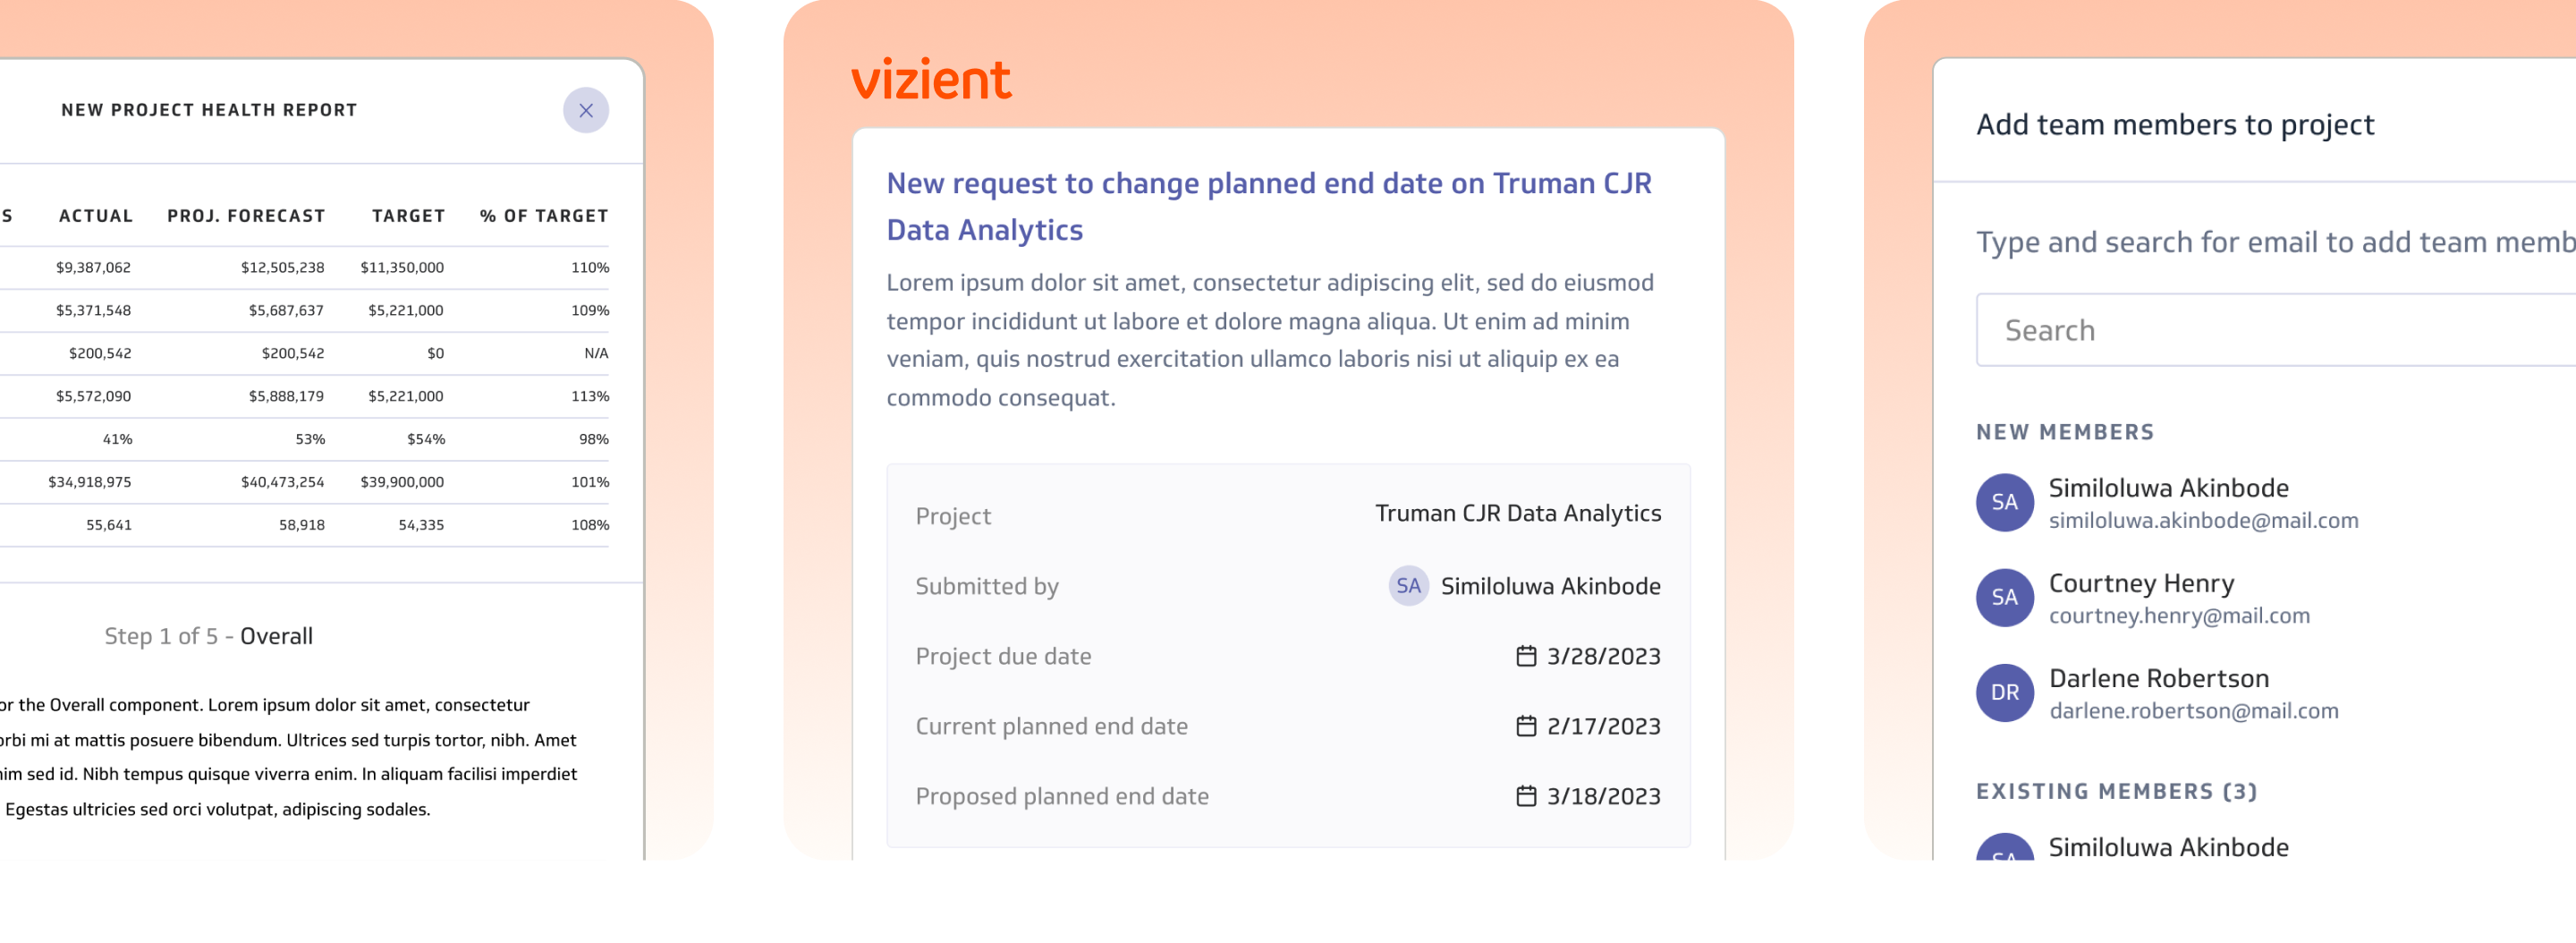
In order to make informed decisions, project leads needed relevant information for the task they were completing at their fingertips. When scheduling hours for people on a project they needed to know how many hours someone was budgeted for on a project, but also how much time have they actually spent.
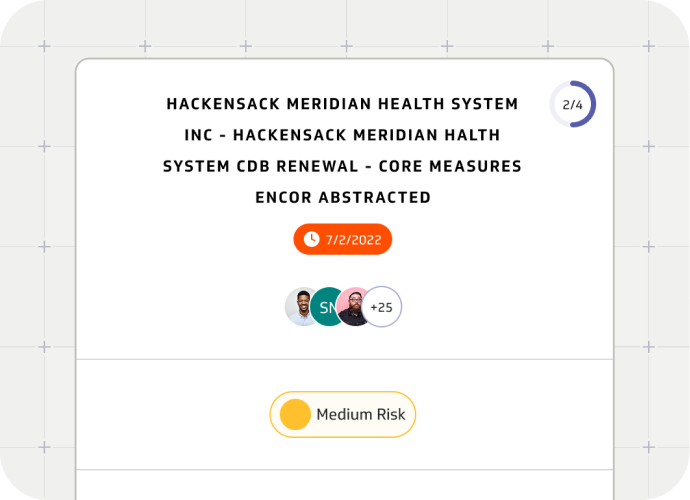
We not only surfaced this information by created visualizations to make it easy for project leads to digest and act on the information. Similarly, for project health reports we surfaced up-to-date information about each project so project leads could provide accurate assessments and give qualitative updates based on the quantitative data.
SUBHEADLINE
In a world where creativity meets organization, our platform offers a seamless experience for those planning unforgettable gatherings. With tools to curate guest lists, dispatch invitations, and monitor responses, we ensure every event is a success.
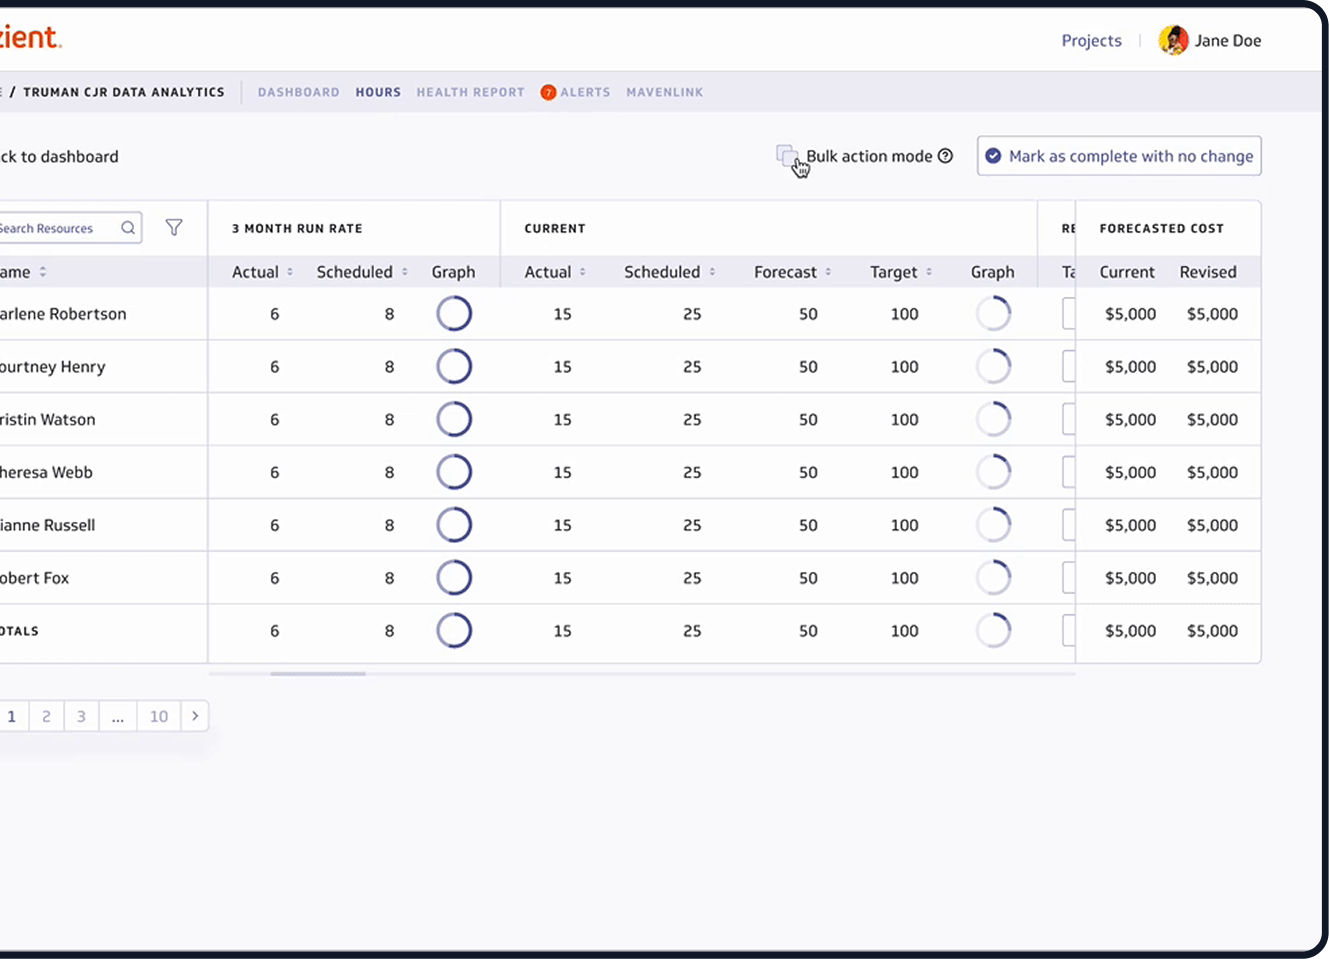
In order to make informed decisions, project leads needed relevant information for the task they were completing at their fingertips. When scheduling hours for people on a project they needed to know how many hours someone was budgeted for on a project, but also how much time have they actually spent.
We not only surfaced this information by created visualizations to make it easy for project leads to digest and act on the information. Similarly, for project health reports we surfaced up-to-date information about each project so project leads could provide accurate assessments and give qualitative updates based on the quantitative data.