
.avif)
Every Friday at 2 p.m., Sarah, an operations director at a mid-sized foster care agency, begins what her team has dubbed "The Report Marathon." For the next four hours, she'll manually pull data from five different systems, cross-reference spreadsheets, and compile board packets that should tell the story of their impact. By 6 p.m., she's exhausted, the numbers don't quite add up, and she's already dreading next Friday's repeat performance.
Sarah's story isn't unique. Across the nonprofit sector, leaders are drowning in data while starved for insights. They know their organizations are making a difference, but proving, quantifying, and optimizing that impact feels impossible when your "data system" consists of disconnected software platforms and an ever-growing collection of Excel files.
What if there was a better way? What if the same business intelligence (BI) tools that help Fortune 500 companies make smarter decisions could transform how nonprofits operate, report, and amplify their impact?
The reality is that business intelligence dashboards aren't just for corporate boardrooms. They're essential tools for nonprofit leaders who want to spend less time wrestling with data and more time advancing their mission.
The hidden cost of data chaos in nonprofit organizations
The challenges nonprofits face with data management extend far beyond mere inconvenience: they represent a fundamental barrier to organizational effectiveness and mission advancement.
Research from Stanford Social Innovation Review reveals a stark reality: program staff at nonprofits spend 25% of their time collecting data manually, with some staff members dedicating up to 50% of their time to data entry tasks. This isn't just inefficient; it's a misallocation of human resources that directly impacts an organization's ability to serve its beneficiaries.
Consider the math: if your Operations Manager earns $65,000 annually and spends 15 hours per week on manual data tasks, that's $23,400 in salary dedicated purely to moving numbers around spreadsheets. Multiply this across your entire team, and the hidden cost of data chaos is staggering.
But the financial cost pales in comparison to the opportunity cost. Every hour spent manually reconciling donor databases is an hour not spent cultivating relationships with supporters. Every Friday afternoon lost to board packet preparation is strategic thinking time that could be used to identify new program opportunities or address emerging community needs.
.avif)
The challenge compounds when you consider the regulatory environment nonprofits operate within. Grant reporting requirements often consume 31% of a grant's value in administrative time, despite funders budgeting only 13% for overhead costs. This creates a vicious cycle where organizations must choose between comprehensive reporting and program delivery — a choice no mission-driven leader should have to make.
Perhaps most concerning is the erosion of trust in organizational data. When numbers don't align across systems, reports require constant manual adjustments, and "the data person" leaving means institutional knowledge walks out the door, leadership loses confidence in their ability to make data-driven decisions. This uncertainty trickles down through the organization, affecting everything from strategic planning to donor communications.
What business intelligence means for nonprofits
Business intelligence, in its simplest form, is the technology and processes that transform raw data into meaningful insights for decision-making. For nonprofits, this means creating a unified view of organizational performance that connects program outcomes, financial health, operational efficiency, and stakeholder engagement in real-time.
Unlike traditional reporting methods that provide snapshots of past performance, business intelligence dashboards offer dynamic, interactive tools that help leaders understand not just what happened, but why it happened and what might happen next. They transform static spreadsheets into living documents that update automatically, provide drill-down capabilities, and highlight trends that might otherwise go unnoticed.
The beauty of modern BI tools lies in their ability to integrate disparate data sources. Your donor management system, volunteer platform, program tracking software, and financial systems can all feed into a central dashboard that provides a holistic view of organizational health. This integration eliminates the manual data reconciliation that consumes so much staff time while dramatically improving data accuracy and consistency.
For nonprofit leaders, business intelligence represents a shift from reactive to proactive management. Instead of discovering problems after they've occurred, BI dashboards can identify concerning trends early, flag unusual patterns, and provide the insights needed to course-correct before small issues become major challenges.
Moreover, modern BI solutions are also designed with accessibility in mind. You don't need a computer science degree to build meaningful dashboards or interpret complex data visualizations. Many platforms offer drag-and-drop interfaces, pre-built templates, and intuitive design tools that put the power of data analysis directly into the hands of program managers, development directors, and executive leadership.
Five ways business intelligence dashboards transform nonprofit operations
1. Real-time program monitoring and impact measurement
Traditional program evaluation often feels like trying to steer a ship by looking at where you were an hour ago. Business intelligence dashboards change this dynamic by providing real-time visibility into program performance, participant outcomes, and resource utilization.
Imagine having a dashboard that shows you, at any moment, how many clients are currently enrolled in each program, their progress toward specific milestones, and which interventions are proving most effective. Instead of waiting for quarterly reports to identify struggling participants, case managers can receive automated alerts when clients miss appointments or fall behind on goals, enabling immediate intervention.
.avif)
For a workforce development nonprofit, this might mean tracking job placement rates, wage improvements, and retention statistics in real-time. For a youth mentoring organization, it could involve monitoring mentor-mentee match success, program completion rates, and long-term outcomes for participants. The key is having immediate access to the metrics that matter most for your specific mission.
This real-time visibility extends beyond individual participant tracking to program-level insights. Dashboards can reveal which program components are most effective, identify optimal group sizes for maximum impact, and highlight geographic or demographic patterns that inform strategic decisions about resource allocation and program expansion.
The impact measurement capabilities of BI dashboards also support more compelling storytelling to stakeholders. Instead of generic impact reports filled with aggregate statistics, organizations can create dynamic presentations that show funders exactly how their investments are generating outcomes, complete with trend analysis and comparative benchmarks.
2. Strategic financial oversight and resource allocation
Financial management in nonprofits requires balancing multiple funding streams, tracking restricted and unrestricted funds, and maintaining compliance with various grant requirements. Business intelligence dashboards bring clarity to this complexity by creating unified financial views that help leaders optimize resource allocation and identify sustainability opportunities.
A comprehensive financial dashboard might display cash flow projections, grant expenditure rates, fundraising performance by channel, and program cost-per-outcome metrics, all in one place. This integrated view enables leaders to spot concerning trends and adjust strategies accordingly (like a major donor's giving pattern changing or grant funds being spent faster than anticipated).
The budgeting process becomes more strategic when supported by historical data and predictive analytics. Instead of simply adding 3% to last year's budget, leaders can use BI tools to analyze program efficiency trends, identify cost-saving opportunities, and model different scenarios for the coming year. This data-driven approach to budgeting builds confidence among board members and funders while ensuring resources are allocated where they can generate maximum impact.
Dashboards also excel at making the complex simple when it comes to compliance reporting. Grant-specific dashboards can automatically track expenditures against budget categories, alert administrators when spending thresholds are approaching, and generate the detailed reports that funders require. This automation dramatically reduces the administrative burden of managing multiple grants while improving accuracy and compliance.
For development teams, BI dashboards provide unprecedented insight into fundraising effectiveness. Leaders can track donor acquisition costs, lifetime value calculations, retention rates by donor segment, and the ROI of different fundraising activities. This granular analysis enables more strategic investment in development activities and more compelling cases for support when approaching major donors.
3. Enhanced donor relationship management and stewardship
Effective donor stewardship requires understanding not just who gives and how much, but why they give, when they're most likely to give again, and what communication preferences will resonate with them. Business intelligence dashboards transform donor relationship management from a reactive, one-size-fits-all approach to a personalized, data-driven strategy.
Modern BI tools can analyze giving patterns to identify donors who are at risk of lapsing, highlight opportunities for upgrade asks, and suggest optimal timing for stewardship touches. For example, a dashboard might reveal that donors who give in December but don't receive personalized follow-up within 60 days are 40% more likely to lapse the following year… actionable insight that can immediately improve retention strategies.
Segmentation becomes more sophisticated when powered by comprehensive data analysis. Instead of broad categories like "major donors" and "everyone else," BI tools can identify micro-segments based on giving history, engagement patterns, demographic characteristics, and interaction preferences. This enables highly targeted communication strategies that speak directly to what motivates each donor segment.
The integration capabilities of BI platforms also enable more holistic donor engagement tracking. By connecting donation data with event attendance, volunteer participation, email engagement, and social media interactions, organizations can develop 360-degree donor profiles that inform more meaningful relationship-building strategies.
Predictive analytics takes donor management to the next level by identifying prospects most likely to become major donors, predicting optimal ask amounts, and forecasting giving trends that inform strategic planning. These insights enable development teams to focus their limited time and resources on activities most likely to generate significant returns.
4. Operational efficiency and staff productivity optimization
Beyond financial and program metrics, business intelligence dashboards can dramatically improve operational efficiency by providing visibility into staff productivity, resource utilization, and workflow bottlenecks. This operational intelligence helps leaders make more informed decisions about staffing, technology investments, and process improvements.
Time tracking integration allows organizations to understand the true cost of service delivery while identifying opportunities for efficiency improvements. A dashboard might reveal that certain administrative tasks are consuming disproportionate staff time, or that specific programs require more resources than originally budgeted. This insight enables more accurate program costing and more strategic resource allocation decisions.
Workflow analysis through BI tools can identify bottlenecks in client intake processes, grant application procedures, or volunteer onboarding systems. By visualizing how long each step takes and where delays typically occur, organizations can implement targeted improvements that enhance both staff efficiency and stakeholder experience.
Staff productivity dashboards, when implemented thoughtfully and transparently, can help team members understand their own performance while enabling managers to provide more targeted support and professional development. The key is focusing on system improvements rather than individual performance evaluation, using data to identify training needs or process improvements rather than punitive measures.
The insights generated by operational BI dashboards also support more strategic hiring decisions. By analyzing workload trends, seasonal patterns, and skill gap analyses, leaders can time new hires more effectively and ensure job descriptions align with actual organizational needs rather than assumptions about required roles.
5. Board reporting and stakeholder communication
Board meetings often feel like information overload followed by decision paralysis. Business intelligence dashboards transform board governance by providing clear, actionable insights that enable more strategic discussions and more confident decision-making.
Instead of dense financial reports and lengthy program updates, board members can access interactive dashboards that allow them to explore organizational performance at whatever level of detail interests them. A board member curious about fundraising trends can drill down into specific donor segments, while another interested in program outcomes can examine participant success rates by location or demographic characteristics.
The visual nature of BI dashboards makes complex information more accessible to board members with varying levels of technical expertise. Trend lines, heat maps, and comparative charts communicate organizational performance more effectively than tables of numbers, enabling more productive strategic discussions.
Real-time dashboard access also enables more engaged board governance between meetings. Board members can monitor organizational performance throughout the quarter, ask informed questions, and arrive at meetings prepared for strategic discussions rather than spending time getting up to speed on basic operational metrics.
For external stakeholder communication, BI dashboards enable more compelling and transparent reporting. Grant reports can include dynamic visualizations that clearly demonstrate impact, while donor communications can be personalized with specific metrics that align with individual giving interests and motivations.
Getting started: A practical roadmap for nonprofit leaders
The prospect of implementing business intelligence might feel overwhelming, especially for organizations already stretched thin on resources and technical expertise. However, the path to data-driven decision making doesn't require massive upfront investments or complete system overhauls. Success comes from starting small, focusing on high-impact use cases, and building momentum through quick wins.
.avif)
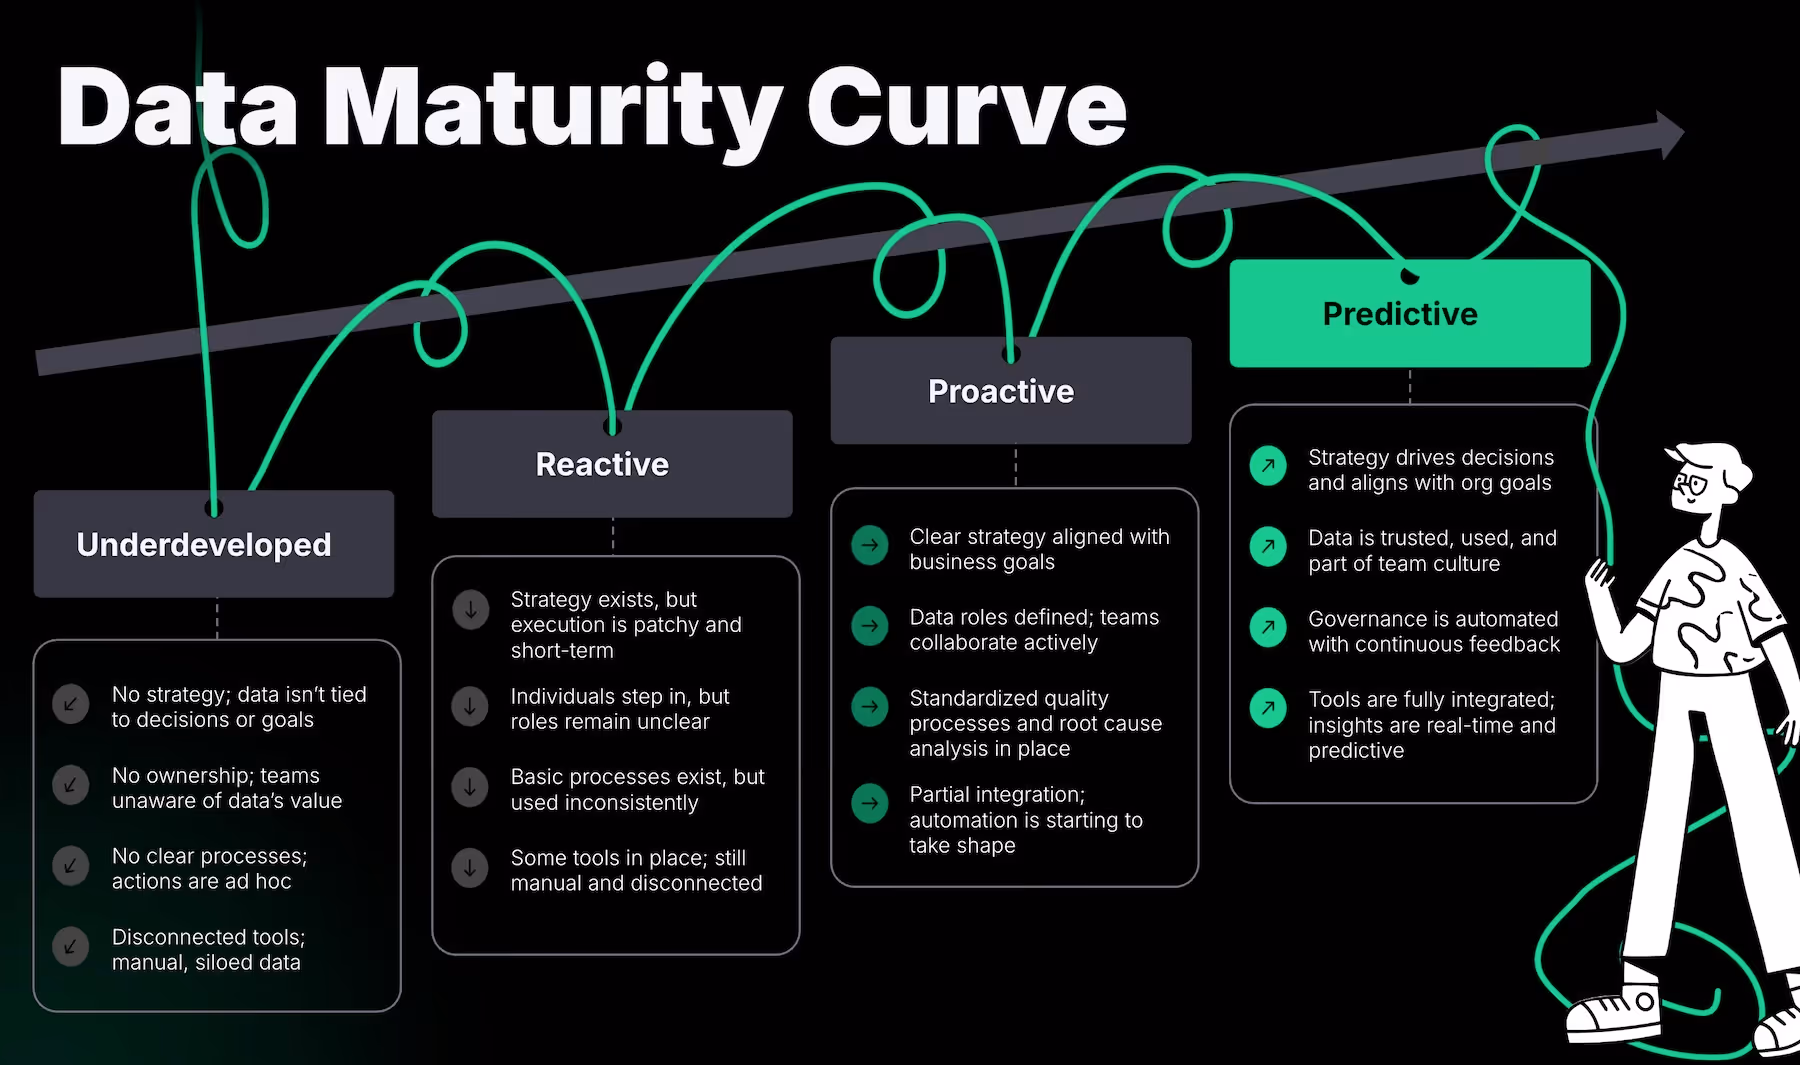
Step 1: Assess your current data landscape
Begin by conducting an honest audit of your existing data sources and reporting processes. Use our data maturity assessment if you are not sure where you get started. Catalog every system your organization uses, from your donor management platform to your volunteer coordination software to your program tracking spreadsheets. Document how data flows between these systems, who's responsible for maintaining each source, and how long current reporting processes take.
This assessment will likely reveal duplicate data entry, inconsistent definitions across systems, and significant time investments in manual reconciliation. Don't be discouraged by what you discover; every organization has data challenges, and identifying them clearly is the first step toward improvement.
Pay particular attention to the questions your leadership team asks most frequently. What metrics do board members request at every meeting? What information do funders require for reports? What operational insights would help program managers be more effective? These frequent information needs represent your highest-value dashboard opportunities.
Step 2: Start with one critical question
Rather than trying to solve every data challenge simultaneously, identify the single most important question your organization needs answered on a regular basis. This might be "How many clients are we currently serving?" for a direct service organization, or "What's our cash flow projection for the next six months?" for an organization managing multiple grants.
Build your first dashboard around this one critical question, ensuring it updates automatically and provides the drill-down capabilities leadership needs. This focused approach allows you to learn the technology, refine your processes, and demonstrate value before expanding to more complex use cases.
Success with your first dashboard builds organizational confidence in data-driven decision making while providing tangible time savings that can be reinvested in additional improvements. It also helps you identify integration challenges and develop solutions before tackling more ambitious projects.
Step 3: Choose the right tools and partners
The business intelligence landscape includes options for every budget and technical capability level. Cloud-based platforms like Microsoft Power BI, Tableau, and Google Data Studio offer powerful capabilities without requiring significant technical infrastructure investments. Many also provide nonprofit discounts that make enterprise-level tools accessible to smaller organizations.
However, technology selection should be secondary to strategic planning. Focus first on what you want to achieve, then identify tools that align with your goals, budget, and technical capabilities. Consider factors like ease of use, integration capabilities with your existing systems, ongoing costs, and available support resources.
For many nonprofits, partnering with technology consultants who understand the sector can accelerate implementation while building internal capabilities. Look for partners who emphasize knowledge transfer and skill building rather than creating dependency relationships. The goal should be to develop internal capacity to maintain and expand your BI capabilities over time.
Step 4: Build organizational data literacy
Business intelligence tools are only as effective as the people using them. Invest in building data literacy across your organization, ensuring that staff members at all levels can interpret dashboard insights and incorporate data into their decision-making processes.
This doesn't mean everyone needs to become a data analyst, but program managers should understand how to read trend analysis, development staff should be comfortable with donor segmentation concepts, and leadership should know how to ask good questions of their data. Many BI platforms include training resources, and online courses in data literacy are increasingly available.
Create a culture that values data-driven decision making by celebrating insights that lead to program improvements, operational efficiencies, or strategic breakthroughs. Share success stories across the organization and recognize staff members who use data effectively to advance the mission.
For a deeper dive into this topic, watch our free Nonprofit Guide to a Single Source of Truth webinar.
The future of data-driven nonprofit leadership
As artificial intelligence and machine learning capabilities become more accessible, the potential for nonprofit business intelligence will continue expanding. Predictive analytics will help organizations identify at-risk participants before interventions are needed, optimize program delivery for maximum impact, and forecast funding needs with unprecedented accuracy.
Integration capabilities will continue improving, making it easier to connect diverse data sources and create comprehensive organizational views. Real-time data collection through mobile apps, IoT sensors, and automated systems will provide even more timely insights into program effectiveness and operational efficiency.
However, the most important trend is cultural, not technological. The nonprofit sector is increasingly embracing data-driven decision making as essential to effective stewardship of donor investments and community trust. Organizations that develop strong BI capabilities now will be better positioned to demonstrate impact, secure funding, and adapt to changing community needs in the years ahead.
Foundationally, your nonprofit needs business intelligence capabilities. But the true question is whether you'll develop them proactively or reactively. Organizations that invest in BI tools and data literacy today will spend less time on administrative tasks and more time advancing their missions. They'll make more informed strategic decisions, provide more compelling stakeholder communications, and ultimately create greater community impact.
For nonprofit leaders ready to move beyond Friday afternoon reporting marathons and embrace data-driven decision making, business intelligence dashboards represent more than operational efficiency improvements. They represent a fundamental shift toward more strategic, effective, and sustainable approaches to advancing social good.
The data is there. The tools are accessible. But what will your organization accomplish when data becomes your strategic advantage rather than your administrative burden?
Your mission deserves nothing less than your best strategic thinking, informed by comprehensive insights and freed from the constraints of manual data management. Business intelligence dashboards can make that vision a reality: starting today.


.avif)